AUGUST 2023 METRO VANCOUVER HOUSING MARKET HIGHLIGHTS
HOUSING MARKET: Seasonal Slowdown Brings Price Stability to Metro Vancouver
Source: REBGV
As summer winds to a close, higher borrowing costs have begun to permeate the Metro Vancouver1 housing market in predictable ways, with price gains cooling and sales slowing along the typical seasonal pattern.
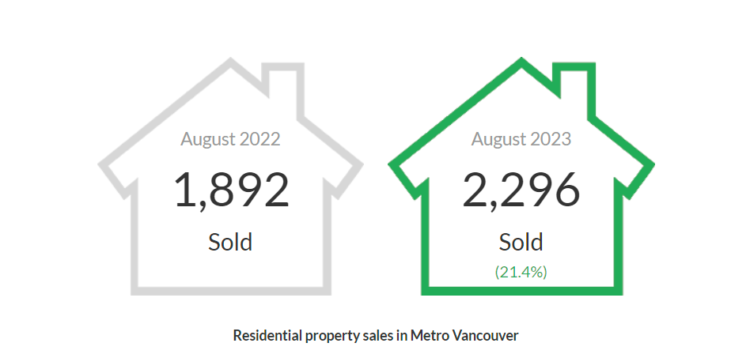
The Real Estate Board of Greater Vancouver (REBGV) reports that residential home sales2 in the region totalled 2,296 in August 2023, a 21.4 per cent increase from the 1,892 sales recorded in August 2022. This was 13.8 per cent below the 10-year seasonal average (2,663).
“It’s been an interesting spring and summer market, to say the least. Borrowing costs are fluctuating around the highest levels we’ve seen in over ten years, yet Metro Vancouver’s housing market bucked many pundits’ predictions of a major slowdown, instead posting relatively strong sales numbers and year-to-date price gains north of eight per cent, regardless of home type.”
Andrew Lis, REBGV director of economics and data analytics
There were 3,943 detached, attached and apartment properties newly listed for sale on the Multiple Listing Service® (MLS®) in Metro Vancouver in August 2023. This represents an 18.1 per cent increase compared to the 3,340 homes listed in August 2022. This was 5.3 per cent below the 10-year seasonal average (4,164).
The total number of homes currently listed for sale on the MLS® system in Metro Vancouver is 10,082, a 0.2 per cent decrease compared to August 2022 (10,099). This was 13.4 per cent below the 10-year seasonal average (11,647).
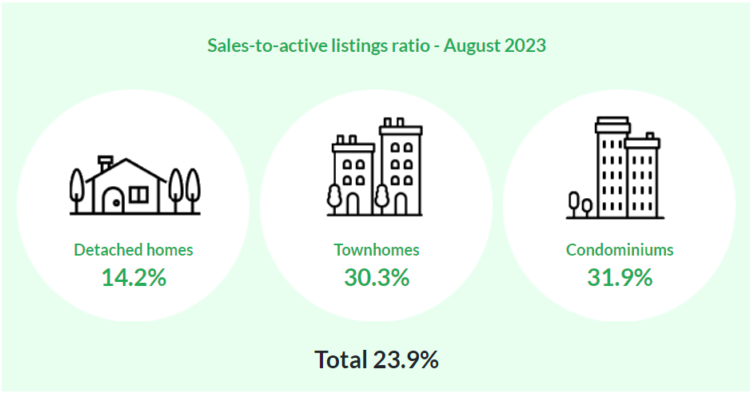
Across all detached, attached and apartment property types, the sales-to-active listings ratio for August 2023 is 23.9 per cent. By property type, the ratio is 14.2 per cent for detached homes, 30.3 per cent for townhomes, and 31.9 per cent for apartments.
Analysis of the historical data suggests downward pressure on home prices occurs when the ratio dips below 12 per cent for a sustained period, while home prices often experience upward pressure when it surpasses 20 per cent over several months.
“It’s a bit of a tortoise and hare story this year, with sales starting the year slowly while prices increased due to low inventory levels,” Lis said. “As fall approaches, sales have caught up with the price gains, but both metrics are now slowing to a pace that is more in-line with historical seasonal patterns, and with what one might expect given that borrowing costs are where they are.”
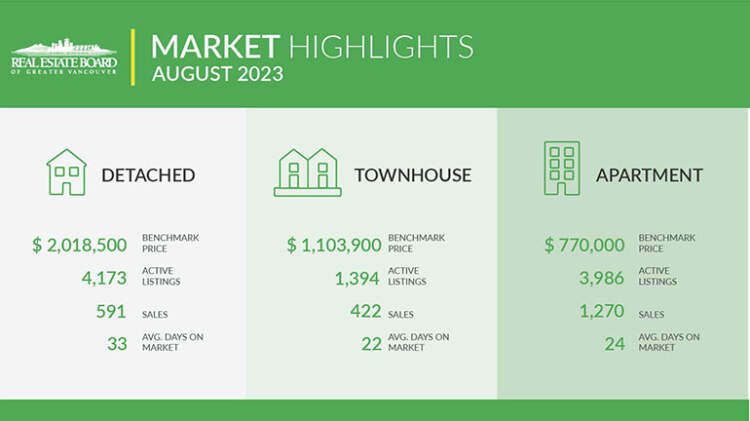
The MLS® Home Price Index composite benchmark price for all residential properties in Metro Vancouver is currently $1,208,400. This represents a 2.5 per cent increase over August 2022 and a 0.2 per cent decrease compared to July 2023.
Sales of detached homes in August 2023 reached 591, a 13.2 per cent increase from the 522 detached sales recorded in August 2022. The benchmark price for a detached home is $2,018,500. This represents a 3.3 per cent increase from August 2022 and a 0.3 per cent increase compared to July 2023.
Sales of apartment homes reached 1,270 in August 2023, a 27.4 per cent increase compared to the 997 sales in August 2022. The benchmark price of an apartment home is $770,000. This represents a 4.4 per cent increase from August 2022 and a 0.2 per cent decrease compared to July 2023.
Attached home sales in August 2023 totalled 422, an 18.9 per cent increase compared to the 355 sales in August 2022. The benchmark price of an attached home is $1,103,900. This represents a 3.9 per cent increase from August 2022 and a 0.1 per cent decrease compared to July 2023.
1 Areas covered by the Real Estate Board of Greater Vancouver include: Bowen Island, Burnaby, Coquitlam, Maple Ridge, New Westminster, North Vancouver, Pitt Meadows, Port Coquitlam, Port Moody, Richmond, South Delta, Squamish, Sunshine Coast, Vancouver, West Vancouver, and Whistler.
2 REBGV is now including multifamily and land sales and listings in this monthly report. Previously, we only included detached, attached, and apartment sales, and these additional categories, which typically account for roughly one to two per cent of total MLS® activity per month, are being included for completeness in our reporting.
CLICK HERE – Full REBGV August 2023 Market Update
Vancouver BC – September 5, 2023
Have a look at the REBGV August 2023 Market Update Insights!
- DOWNLOAD the REBGV August 2023 Market Update CLICK HERE
- See the Monthly Market Stats CLICK HERE
- For more market information from the Real Estate Board of Greater Vancouver CLICK HERE
- To view Geoff Jarman’s Listings CLICK HERE
Tags: real estate Vancouver, Vancouver real estate, Vancouver realestate, home sales, Vancouver homes sale, house prices, housing prices, house buying, real estate vancouver market, Vancouver market, real estate agent Vancouver, Burnaby realtor, Geoff Jarman, Geoff Jarman top Burnaby realtor, 2023 market news, Vancouver Multifamily Market, August 2023 market news, housing market