MARCH 2023 METRO VANCOUVER HOUSING MARKET HIGHLIGHTS
MARCH 2023: Spring Brings Price Growth While New Listings Remain Dormant
Source: REBGV
Home prices across Metro Vancouver’s1 housing market showed modest increases in March, while new listings remained below long-term historical averages.
March data also indicates home sales are making a stronger than expected spring showing so far, despite elevated borrowing costs.
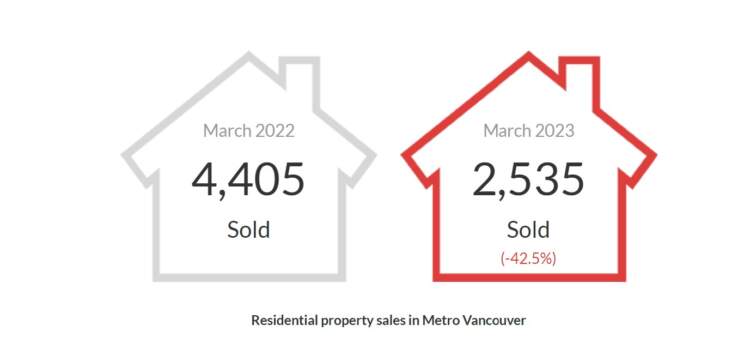
The Real Estate Board of Greater Vancouver (REBGV) reports that residential home sales in the region totalled 2,5352 in March 2023, a 42.5 per cent decrease from the 4,405 sales recorded in March 2022, and 28.4 per cent below the 10-year seasonal average (3,540).
The MLS® Home Price Index composite benchmark price for all residential properties in Metro Vancouver is currently $1,143,900. This represents a 9.5 per cent decrease over March 2022 and a 1.8 per cent increase compared to February 2023.
“On the pricing side, the spring market is already on track to outpace our 2023 forecast, which anticipated modest price increases of about one to two per cent across all product types. The surprising part of this recent activity is that these price increases are occurring against a backdrop of elevated borrowing costs, below-average sales, and new listing activity that continues to suggest that sellers are awaiting more favorable market conditions.”
Andrew Lis, REBGV director of economics and data analytics
There were 4,317 detached, attached and apartment properties newly listed for sale on the Multiple Listing Service® (MLS®) in Metro Vancouver in March 2023. This represents a 35.5 per cent decrease compared to the 6,690 homes listed in March 2022, and was 22.3 per cent below the 10-year seasonal average (5,553).
The total number of homes currently listed for sale on the MLS® system in Metro Vancouver is 8,617, an 8.1 per cent increase compared to March 2022 (7,970), and 17.3 per cent below the 10-year seasonal average (10,421).
Across all detached, attached and apartment property types, the sales-to-active listings ratio for March 2023 is 30.7 per cent. By property type, the ratio is 23.3 per cent for detached homes, 36.7 per cent for townhomes, and 34.9 per cent for apartments.
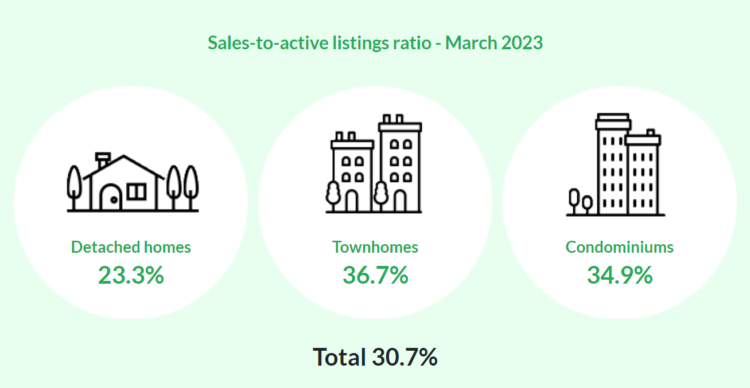
Analysis of historical data suggests downward pressure on home prices occurs when the ratio dips below 12 per cent for a sustained period, while home prices often experience upward pressure when it surpasses 20 per cent over several months.
“If home sellers remain on the sidelines, monthly MLS® sales figures will continue to appear lower than historical averages as we move toward summer,” Lis said. “But it’s important to recognize the chicken-and-egg nature of these statistics. The number of sales in any given month is partially determined by the number of homes that come to market that month, along with the inventory of unsold homes listed in previous months. With fewer homes coming on the market, homes sales will remain lower than we’re accustomed to seeing at this point in the year, almost entirely by definition.”
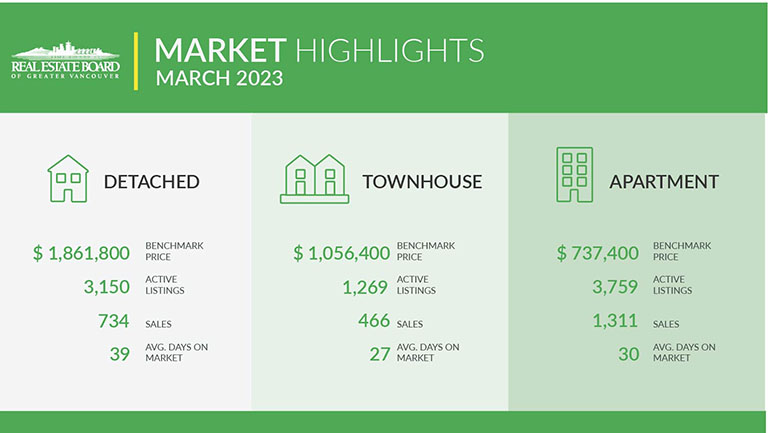
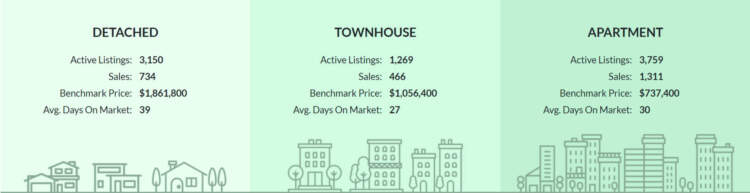
Sales of detached homes in March 2023 reached 734, a 43.6 per cent decrease from the 1,302 detached sales recorded in March 2022. The benchmark price for detached properties is $1,861,800. This represents an 11.2 per cent decrease from March 2022 and a 2.7 per cent increase compared to February 2023.
Sales of apartment homes reached 1,311 in March 2023, a 43.2 per cent decrease compared to the 2,310 sales in March 2022. The benchmark price of an apartment property is $737,400. This represents a 4.6 per cent decrease from March 2022 and a 0.7 per cent increase compared to February 2023.
Attached home sales in March 2023 totalled 466, a 37.3 per cent decrease compared to the 743 sales in March 2022. The benchmark price of an attached unit is $1,056,400. This represents a 7.8 per cent decrease from March 2022 and a 1.7 per cent increase compared to February 2023.
1. Editor’s Note: Areas covered by the Real Estate Board of Greater Vancouver include: Bowen Island, Burnaby, Coquitlam, Maple Ridge, New Westminster, North Vancouver, Pitt Meadows, Port Coquitlam, Port Moody, Richmond, South Delta, Squamish, Sunshine Coast, Vancouver, West Vancouver, and Whistler.
2. REBGV is now including multifamily and land sales and listings in this monthly report. Previously, we only included detached, attached, and apartment sales, and these additional categories, which typically account for less than one to two per cent of total MLS® activity per month, are being included for completeness in our reporting.
* Areas covered by the Real Estate Board of Greater Vancouver include: Burnaby, Coquitlam, Maple Ridge, New Westminster, North Vancouver, Pitt Meadows, Port Coquitlam, Port Moody, Richmond, South Delta, Squamish, Sunshine Coast, Vancouver, West Vancouver, and Whistler.
CLICK HERE – Full REBGV March 2023 Market Update
Vancouver BC – April 4, 2023
Have a look at the REBGV March 2023 Market Update Insights!
- DOWNLOAD the REBGV March 2023 Market Update CLICK HERE
- See the Monthly Market Stats CLICK HERE
- For more market information from the Real Estate Board of Greater Vancouver CLICK HERE
- To view Geoff Jarman’s Listings CLICK HERE
Tags: real estate Vancouver, Vancouver real estate, vancouver realestate, home sales, vancouver homes sale, house prices, housing prices, house buying, real estate vancouver market, vancouver market, real estate agent Vancouver, burnaby realtor, Geoff Jarman, Geoff Jarman top Burnaby realtor, 2023 market news, Vancouver Multifamily Market, March 2023 market news, housing market