Metro Vancouver* home-sale trends observed in October continued in November, as sales registered on the MLS® remained lower than this time last year. The Greater Vancouver REALTORS® (GVR) reports that residential sales in the region totalled 1,846 in November 2025, a 15.4 per cent decrease from the 2,181 sales recorded in November 2024. This was 20.6 per cent below the 10-year seasonal average (2,324).
“As the year draws to a close, the data continues telling a story of a market with many buyers patiently waiting and sellers adjusting to market conditions not seen in years. Inventory remains healthy, providing buyers ample choice, which, by contrast, is pushing sellers to accept that pricing must reflect this new reality. Buyers and sellers are striking deals when their expectations are aligned and reflective of the current market – not the market of years ago.”
Andrew Lis, GVR chief economist and vice-president data analytics
There were 3,674 detached, attached and apartment properties newly listed for sale on the Multiple Listing Service® (MLS®) in Metro Vancouver in November 2025. This represents a 1.4 per cent decrease compared to the 3,725 properties listed in November 2024. This was 3.1 per cent above the 10-year seasonal average (3,562). The total number of properties currently listed for sale on the MLS® system in Metro Vancouver is 15,149, a 14.4 per cent increase compared to November 2024 (13,245). This is 36.3 per cent above the 10-year seasonal average (11,116).
Source: GVR
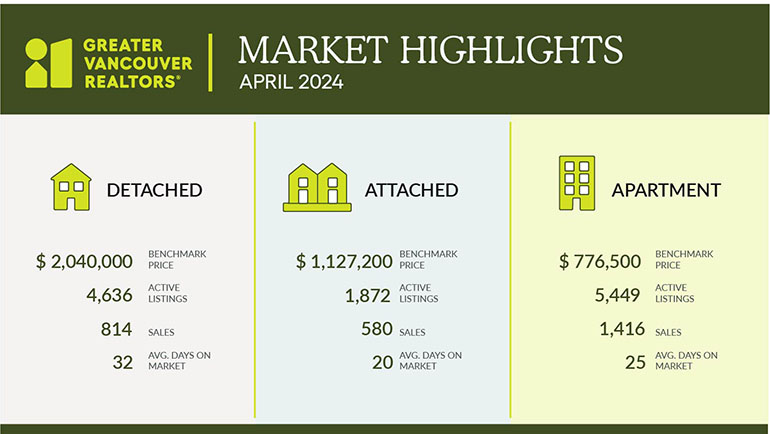
Across all detached, attached and apartment property types, the sales-to-active listings ratio for November 2025 is 12.6 per cent. By property type, the ratio is 9.7 per cent for detached homes, 13.6 per cent for attached, and 14.8 per cent for apartments. Analysis of the historical data suggests downward pressure on home prices occurs when the ratio dips below 12 per cent for a sustained period, while home prices often experience upward pressure when it surpasses 20 per cent over several months. “As sales volumes remain subdued and inventory remains plentiful, properties are taking longer to sell, and pricing has continued to soften slightly across most market segments,” Lis said. “With borrowing costs likely to remain steady into the new year, any uptick in demand will need to arise from a significant change in buyer sentiment. As December is typically among the quietest months of the year in terms of market activity, the prevailing trends suggest we should expect a quiet close to a year marked by considerable uncertainty.” The MLS® Home Price Index composite benchmark price for all residential properties in Metro Vancouver is currently $1,123,700. This represents a 3.9 per cent decrease over November 2024 and a 0.3 per cent decrease compared to October 2025. Sales of detached homes in November 2025 reached 541, a 13.6 per cent decrease from the 626 detached sales recorded in November 2024. The benchmark price for a detached home is $1,900,600. This represents a 4.3 per cent decrease from November 2024 and a 0.4 per cent decrease compared to October 2025.
* Areas covered by Greater Vancouver REALTORS® include: Bowen Island, Burnaby, Coquitlam, Maple Ridge, New Westminster, North Vancouver, Pitt Meadows, Port Coquitlam, Port Moody, Richmond, South Delta, Squamish, Sunshine Coast, Vancouver, West Vancouver, and Whistler. Greater Vancouver REALTORS® is an association representing more than 15,000 REALTORS® and their companies. The association provides a variety of member services, including the Multiple Listing Service®. For more information on real estate, statistics, and buying or selling a home, contact a local REALTOR® or visit www.gvrealtors.ca.
Have a look at the GVR November 2025 Market Update Insights! DOWNLOAD the GVR November2025 Housing Market Update CLICK HERE For more market update information from the Greater Vancouver REALTORS®, CLICK HERE To view Geoff Jarman’s Listings, CLICK HERE
Tags: Real estate market update November 2025, Burnaby housing inventory trends, Burnaby home prices 2025, Greater Vancouver real estate insights, buyer hesitation Burnaby real estate, Burnaby market report November 2025, detached home prices Burnaby, Burnaby condo market update, Burnaby townhouse inventory levels, Burnaby real estate news November 2025, real estate market slowdown Burnaby, Burnaby property listings increase, should I buy in Burnaby 2025, Burnaby housing market analysis, Metro Vancouver real estate trends, Geoff Jarman Burnaby realtor, Geoff Jarman real estate market insights, Burnaby real estate agent Geoff Jarman, Burnaby real estate expert Geoff Jarman, market update November 2025, market update, Burnaby Realtor, Geoff Jarman top Burnaby realtor, Best realtors in Burnaby for first-time homebuyers
Home sales registered on the MLS® in Metro Vancouver* were 14 per cent lower than last October, as the trend of slower sales and building inventory creates favourable conditions for those looking to buy in the fall market. The Greater Vancouver REALTORS® (GVR) reports that residential sales in the region totalled 2,255 in October 2025, a 14.3 per cent decrease from the 2,632 sales recorded in October 2024. This was 14.5 per cent below the 10-year seasonal average (2,638).
“October is typically the last month of the year where sales activity sees a seasonal uptick, but sales still fell short of last year’s figures and the ten-year seasonal average. Even the fourth cut this year to the Bank of Canada’s policy rate this October wasn’t enough to entice more buyers back into the market.”
Andrew Lis, GVR chief economist and vice-president data analytics
There were 5,438 detached, attached and apartment properties newly listed for sale on the Multiple Listing Service® (MLS®) in Metro Vancouver in October 2025. This represents a 0.3 per cent decrease compared to the 5,452 properties listed in October 2024. This was 16.3 per cent above the 10-year seasonal average (4,676). The total number of properties currently listed for sale on the MLS® system in Metro Vancouver is 16,393, a 13.2 per cent increase compared to October 2024 (14,477). This total is 35.9 per cent above the 10-year seasonal average (12,063).
Across all detached, attached and apartment property types, the sales-to-active listings ratio for October 2025 is 14.2 per cent. By property type, the ratio is 11.3 per cent for detached homes, 17.6 per cent for attached, and 15.5 per cent for apartments. Analysis of the historical data suggests downward pressure on home prices occurs when the ratio dips below 12 per cent for a sustained period, while home prices often experience upward pressure when it surpasses 20 per cent over several months. “After peaking in June, inventory levels have edged lower, and prices have eased across all market segments as slower-than-usual sales activity meets the highest inventory levels seen in many years,” Lis said. “With no further reductions to the Bank of Canada’s policy rate expected in 2025, market conditions appear as favorable for buyers as they’ve been all year.” The MLS® Home Price Index composite benchmark price for all residential properties in Metro Vancouver is currently $1,132,500. This represents a 3.4 per cent decrease over October 2024 and a 0.8 per cent decrease compared to September 2025. Sales of detached homes in October 2025 reached 693, a 4.3 per cent decrease from the 724 detached sales recorded in October 2024. The benchmark price for a detached home is $1,916,400. This represents a 4.3 per cent decrease from October 2024 and a 0.9 per cent decrease compared to September 2025. Sales of apartment homes reached 1,071 in October 2025, a 23.1 per cent decrease compared to the 1,393 sales in October 2024. The benchmark price of an apartment home is $718,900. This represents a 5.1 per cent decrease from October 2024 and a 1.4 per cent decrease compared to September 2025. Attached home sales in October 2025 totalled 477, a 4.8 per cent decrease compared to the 501 sales in October 2024. The benchmark price of a townhouse is $1,066,700. This represents a 3.8 per cent decrease from October 2024 and a 0.3 per cent decrease compared to September 2025.
* Areas covered by Greater Vancouver REALTORS® include: Bowen Island, Burnaby, Coquitlam, Maple Ridge, New Westminster, North Vancouver, Pitt Meadows, Port Coquitlam, Port Moody, Richmond, South Delta, Squamish, Sunshine Coast, Vancouver, West Vancouver, and Whistler. Greater Vancouver REALTORS® is an association representing more than 15,000 REALTORS® and their companies. The association provides a variety of member services, including the Multiple Listing Service®. For more information on real estate, statistics, and buying or selling a home, contact a local REALTOR® or visit www.gvrealtors.ca.
Have a look at the GVR October 2025 Market Update Insights! DOWNLOAD the GVR October 2025 Housing Market Update CLICK HERE For more market update information from the Greater Vancouver REALTORS®, CLICK HERE To view Geoff Jarman’s Listings, CLICK HERE
Tags: Real estate market update October 2025, Burnaby housing inventory trends, Burnaby home prices 2025, Greater Vancouver real estate insights, buyer hesitation Burnaby real estate, Burnaby market report October 2025, detached home prices Burnaby, Burnaby condo market update, Burnaby townhouse inventory levels, Burnaby real estate news October 2025, real estate market slowdown Burnaby, Burnaby property listings increase, should I buy in Burnaby 2025, Burnaby housing market analysis, Metro Vancouver real estate trends, Geoff Jarman Burnaby realtor, Geoff Jarman real estate market insights, Burnaby real estate agent Geoff Jarman, Burnaby real estate expert Geoff Jarman, market update October 2025, market update, Burnaby Realtor, Geoff Jarman top Burnaby realtor