Unlocking West Coquitlam’s Real Estate Renaissance
Source: MLA Canada
For those closely monitoring Metro Vancouver’s real estate landscape, all eyes are turning toward West Coquitlam. Following Burnaby’s recent surge, West Coquitlam is not just keeping pace but charting an unprecedented course in its market evolution. The region is a hive of development activity, laying the groundwork for a promising future for both residents and investors alike.
October’s Wave of Transformative Launches
October witnessed a historic moment for Coquitlam as five major projects simultaneously graced the scene, injecting nearly 900 condominium units into the market. This surge, unparalleled in the suburb’s history, signifies a remarkable shift in market dynamics and investor confidence. Among these launches, three concrete builds stand out as trailblazers, marking the commencement of a broader transformation. Intergulf’s Burquitlam Park District, Beedie’s Debut at Fraser Mills, and Intracorp’s Magnolia in Burquitlam collectively introduced 750 units this fall, signaling the advent of an expansive era.

Burquitlam Park District. Source: Burquitlam Park District website

Debut at Fraser Mills. Source: Debut’s website

Magnolia. Source: Magnolia marketing materials
In addition to these, two large wood frame projects emerged in October—Lodana by Circadian Group with 123 condos and townhouses, and Arcadia by Quantum Properties, adding another 120 units over six floors.

Arcadia by Quantum Properties. Source: Arcadia marketing materials

Lodana by Circadian Group. Source: Lodana marketing materials
Unprecedented Development Activity for Coquitlam
This surge is unparalleled for Coquitlam, reflecting a growing interest in a market evolving at an unprecedented pace. Over the past decade, such a combined influx of concrete and wood frame project launches in a single month has been unheard of. Previous years saw more staggered launches, introducing significantly fewer units within a given period.
Comparatively, the rush of activity witnessed in October far surpasses the norm. Even during the comparable surge in the summer of 2022, following an all-time market high, the number of units launched was dwarfed by October’s remarkable activity.
Strong Market Absorption Despite Economic Challenges
Surprisingly, despite a 400 basis point increase in interest rates compared to the summer of 2022, the absorption rates for this wave of new projects have surpassed last year’s figures. The same-month absorption rates for the three concrete projects launched in October reached an impressive 60%, absorbing over 475 units in a single month—higher both in percentage and number compared to the summer of 2022.
This robust performance, particularly exemplified by Lodana’s rapid absorption, defies economic headwinds and positions West Coquitlam as one of the region’s standout suburbs. As we approach 2024, Coquitlam’s resilient performance is poised to redefine the area’s identity, with a diverse array of projects catering to various market segments. Despite economic challenges, West Coquitlam emerges as a key player in the regional real estate scene, shedding its shadow to become a vibrant hub of energy and potential for residents and investors alike.
To read more local news and updates please check our BLOG PAGE
To view Geoff Jarman’s Listings CLICK HERE
To receive more information about presales in West Coquitlam, or visit the presentation center, please fill out the contact form or call Geoff at 604-313-7280

Source: REBGV

Picture source: REBGV
An increase in newly listed properties is providing more choice to home buyers across Metro Vancouver1, but sales remain below long-term averages.
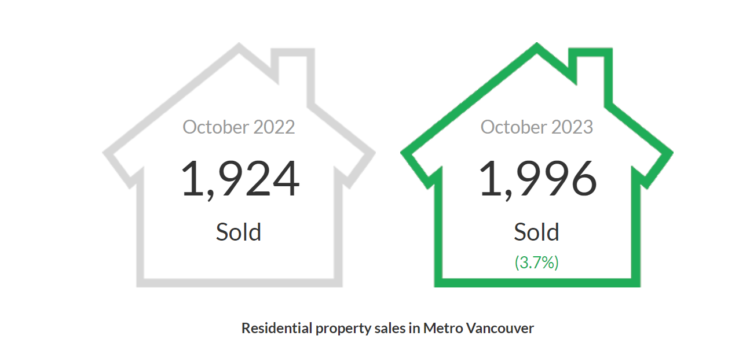
The Real Estate Board of Greater Vancouver (REBGV) reports that residential sales2 in the region totalled 1,996 in October 2023, a 3.7 per cent increase from the 1,924 sales recorded in October 2022. This total is 29.5 per cent below the 10-year seasonal average (2,832) for October.
“With properties coming to market at a rate roughly five per cent above the ten-year seasonal average, there seems to be a continuation of the renewed interest on the part of sellers to participate in the market we’ve been watching this fall. Counterbalancing this increase in supply, however, is the fact sales remain almost 30 per cent below their ten-year seasonal average, which tells us demand is not as strong as we might expect this time of year.”
Andrew Lis, REBGV director of economics and data analytics
There were 4,664 detached, attached and apartment properties newly listed for sale on the Multiple Listing Service® (MLS®) in Metro Vancouver in October 2023. This represents a 15.4 per cent increase compared to the 4,043 properties listed in October 2022 and is 4.8 per cent above the 10-year seasonal average (4,449) for the month.
The total number of properties currently listed for sale on the MLS® system in Metro Vancouver is 11,599, a 12.6 per cent increase compared to October 2022 (10,305). This change is also 0.6 per cent above the 10-year seasonal average (11,526).
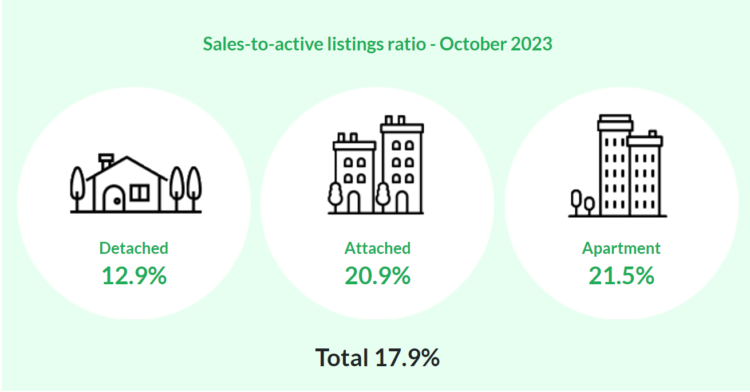
Across all detached, attached and apartment property types, the sales-to-active listings ratio for October 2023 is 17.9 per cent. By property type, the ratio is 12.9 per cent for detached homes, 20.9 per cent for attached, and 21.5 per cent for apartments.
Analysis of the historical data suggests downward pressure on home prices occurs when the ratio dips below 12 per cent for a sustained period, while home prices often experience upward pressure when it surpasses 20 per cent over several months.
“With more supply in the form of resale inventory, and weaker demand in the form of slower sales, we’ve seen market conditions overall adjust towards more balanced conditions. It’s noteworthy that the multifamily segment remains more active than the detached segment at this time,”
Lis said.
“While the highest borrowing costs we’ve seen in over a decade continue to constrain affordability, a silver lining for buyers is that price increases have abated with these more balanced market conditions, meaning purchasing power is holding steady for the moment.”

Picture source: REBGV
The MLS® Home Price Index composite benchmark price for all residential properties in Metro Vancouver is currently $1,196,500. This represents a 4.4 per cent increase over October 2022 and a 0.6 per cent decrease compared to September 2023.
Sales of detached homes in October 2023 reached 577, a 0.7 per cent decrease from the 581 detached sales recorded in October 2022. The benchmark price for a detached home is $2,001,400. This represents a 5.8 per cent increase from October 2022 and a 0.8 per cent decrease compared to September 2023.
Sales of apartment homes reached 1,044 in October 2023, a 4.9 per cent increase compared to the 995 sales in October 2022. The benchmark price of an apartment home is $770,200. This represents a 6.4 per cent increase from October 2022 and a 0.2 per cent increase compared to September 2023.
Attached home sales in October 2023 totalled 356, a 6.6 per cent increase compared to the 334 sales in October 2022. The benchmark price of a townhouse3 is $1,100,500. This represents a 6 per cent increase from October 2022 and a 0.2 per cent increase compared to September 2023.
1 Areas covered by the Real Estate Board of Greater Vancouver include: Bowen Island, Burnaby, Coquitlam, Maple Ridge, New Westminster, North Vancouver, Pitt Meadows, Port Coquitlam, Port Moody, Richmond, South Delta, Squamish, Sunshine Coast, Vancouver, West Vancouver, and Whistler.
2 REBGV is now including multifamily and land sales and listings in this monthly report. Previously, we only included detached, attached, and apartment sales, and these additional categories, which typically account for roughly one to two per cent of total MLS® activity per month, are being included for completeness in our reporting.
3 In calculating the MLS® HPI, Altus Group uses a narrower definition of “attached” properties than is used by REBGV in our “attached” statistics, preferring to use “townhouse” as their benchmark property.
CLICK HERE – Full REBGV October 2023 Housing Market Update
Vancouver BC – November 2, 2023
Have a look at the REBGV October 2023 Market Update Insights!
- DOWNLOAD the REBGV October 2023 Housing Market Update CLICK HERE
- See the Monthly Market Stats CLICK HERE
- For more market information from the Real Estate Board of Greater Vancouver CLICK HERE
- To view Geoff Jarman’s Listings CLICK HERE
Tags: real estate Vancouver, Vancouver real estate, Vancouver realestate, home sales, Vancouver homes sale, house prices, housing prices, house buying, real estate vancouver housing market, Vancouver housing market, real estate agent Vancouver, Burnaby realtor, Geoff Jarman, Geoff Jarman top Burnaby realtor, 2023 market news, Vancouver Multifamily Market, October 2023 market news, housing market,housing market update, housing market news, October housing market


